Simulation Mode Class 101
Have you ever done a systematic review manually, but wondered how much work you could have saved if you had used active learning instead?
With simulation mode you can satisfy your curiosity with ease. Even more so, it can give you insight into ‘odd’ relevant records or help you decide on choosing settings for a new systematic review! Continue reading to learn more about what simulation mode exactly is, what you can do with it and how you can easily perform ASReview simulation studies yourself.
Looking for a specific topic? Skip right to it!

The vocabulary of Elas
- Elas: Our Electronic Learning Assistant, the mascot of ASReview, who helps to explain the machinery behind ASReview.
- Dataset: A file consisting of records.
- Record: A record contains at least a single piece of text and can be unlabeled or labeled (for simulation mode you need labeled data!). The model is trained on the labeled record(s) and the unlabeled records are presented to the user to be screened and labeled. In the case of scientific systematic reviewing, a record contains the meta-data of scientific publications such as the title, abstract, and DOI number. If the DOI is available it will be presented as a clickable hyperlink to the full text.
- Text: the part of a record used for training the model. In the case of systematic reviewing it is the title and abstract of a scientific paper. Be aware of the impact of missing information; the performance of ASReview is optimal if your meta-data is complete.
- Active Learning model: Also referred to as Active Learning settings. Indicates how the next record-to-be-screened by the user is selected. The model consists of four elements:
- Query strategy: The strategy to choose the next record to be shown to the screener. For example Max-strategy (the default), means that the record that is most likely to be relevant will be shown
- Feature extraction technique: The representation of textual content into something more abstract which can be used by an algorithm. An algorithm cannot make predictions from the records as they are.
- Classifier: The machine learning model used to compute the relevance scores.
- Balancing: Data rebalancing strategy. Helps against imbalanced datasets with few inclusions and many exclusions.
- Labeling: Deciding whether a record is relevant or irrelevant.
The word “simulation” may sound like something you would find in the Matrix, but here it is simply an automated reenactment of your screening process. To get a better sense of what simulation mode in ASReview means, we have to start at the root of all simulations: the data.
The Data
When screening titles and abstracts, you label records as relevant or irrelevant. This results in a so-called (partly-)labeled dataset, a dataset of which the relevant records have been labeled as such.
You can put a (partly-/fully-)labeled dataset in exploration mode to explore the performance of the active learning software: How fast can you find all the relevant records? Setting up the exploration mode works the same as ASReview LAB, meaning that you can upload your data, choose a model (you might want to try another classifier for example) and provide prior knowledge. There are two important differences between ASReview LAB and exploration mode. The first is that in exploration mode you use labeled data, instead of unlabeled data. The second difference is that the relevant records are now displayed in green, making it very easy to see what the actual label of an article is.
However, if you want to find out whether a different model would have worked better for your data for example, you would have to screen the whole dataset again, one by one! Yikes, that would probably take a lot of time. Luckily, there is a solution to this inconvenience, drumroll please, simulation mode! With simulation mode the screening is automated. It is basically an automatic exploration mode. You can just relax, grab a coffee or cup of tea, while the computer mimics your screening process in only a fraction of the time!
Simulation studies are not solely meant for cyborgs who want to take over the world (or computer scientists). If you are conducting a systematic review, simulation studies can be very convenient and helpful for you too.
See how much work you could have saved
Simulation mode has multiple purposes, a really convenient one being that you can investigate the amount of work you could have saved by using ASReview LAB compared to your manual screening process. After running multiple simulations you obtain average statistics about your screening process. You can find more information on these metrics and how to interpret them in the statistics section of ‘Interpret results like a pro’.
In this paper by Ferdinands (2020), a simulation study was conducted for this exact purpose. It appeared that after screening only 20% of the articles, while using active learning, already 95% of the relevant records were found.
Find ‘odd’ relevant records
Another functionality of the simulation mode is to find ‘odd’ relevant records. Take a look at the Discovery Time metric for each relevant record, after running multiple simulations. If a record is found isolated from the other relevant records and more towards the end of the screening process, it may indicate three things:
- The record is not similar to the other relevant publications. It might be worthwhile to check the full-text of the record, to make sure it is really relevant for your study.
- The record is part of a different subject cluster within your study. However, no other similar records have been labeled as relevant (yet). This could mean that your initial search was too narrow or that you are not finished with screening yet!
- It might also be the case that the label is incorrect, simply a human error. Perhaps the record was labeled relevant because it was interesting outside the scope of the research question.
In this simulation study on medical guidelines, some odd relevant records were discovered. In line with the first reason above, it turned out that these records were irrelevant after all, or were simply quite different from the other relevant papers (systematic reviews vs. Randomized control trials for example).
Find the best model for a new study
In case you might want to do an update on an older systematic review, you can also use the older data within a simulation study to look for the optimal model in your new study. How does that work? Simply try out different combinations of models (classifier, feature extraction, query strategy and balancing) in simulation studies and see which combination works best!
Advanced: Investigate the performance of active learning components
Maybe you are more familiar already with machine learning, prediction models or simulation studies. Then you could also use simulation mode to test your new classifier against the defaults for example. See for example these two studies on Convolutional Neural Networks by Bart-Jan Boverhof and Jelle Teijema.
The state-file
The results of the simulation are stored in a so-called state-file. This state-file contains all the information regarding your simulation: the prior knowledge provided, specifics on the model that was used, the order of the records shown to the machine and so on. This means that it can become quite large, but the file is essential to analyze the results of the simulation.
Moreover, the state-file allows for transparency and replication of your simulation study, because all the information necessary is present! In fact, you can use this file as supplemental material to your paper and put it on Zenodo or OSF. See this Zenodo repository for an example.
Necessities
Before you can start your own simulation, you will need two things:
- A fully-labeled dataset. This can be a pre-existing dataset to play around with, or you can use your own systematic review dataset. If you upload your own data, make sure to remove duplicates and to retrieve as many abstracts as possible (don’t know how?). With clean data you benefit most from what active learning has to offer.
- The latest version of ASReview LAB + extensions. For an optimal simulation, you need to install or upgrade ASReview LAB to the latest version. Also make sure to have installed the statistics and visualization extensions. These will allow you to get all the interesting numbers and informative figures you need!
For the example simulation study that follows, the dataset from a systematic review on PTSD latent trajectories has been used (see the end of this blogpost for the citation of the article of van de Schoot et al., 2017).
A simulation study in 3 easy steps
Now that all the ingredients have been collected, it is time to start your simulation study. Don’t worry if you have never used Command Prompt or Terminal before, except for launching ASReview of course ;). The steps below will walk you through the whole process.
Step 1: Open the Command Prompt (Windows) or Terminal (MacOS)
Windows user: Go to start and search for ‘Command Prompt’
MacOS user: Open the Applications folder
> Utilities and double-click on Terminal
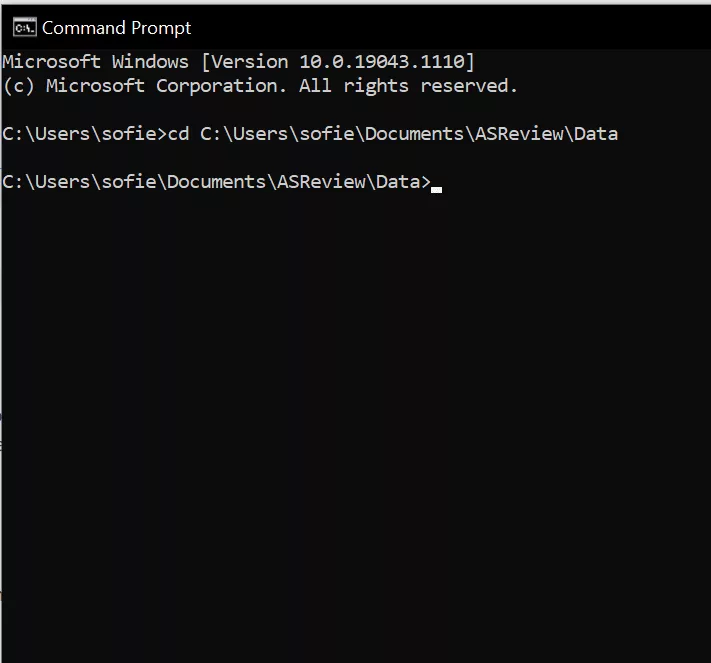
Step 2: Navigate to the folder in which you have saved your dataset.
Find the path to the folder where you have saved your dataset and use it in the following command within Command Prompt or Terminal and press Enter.
cd [your_folder_path_here]

Step 3: Start the simulation
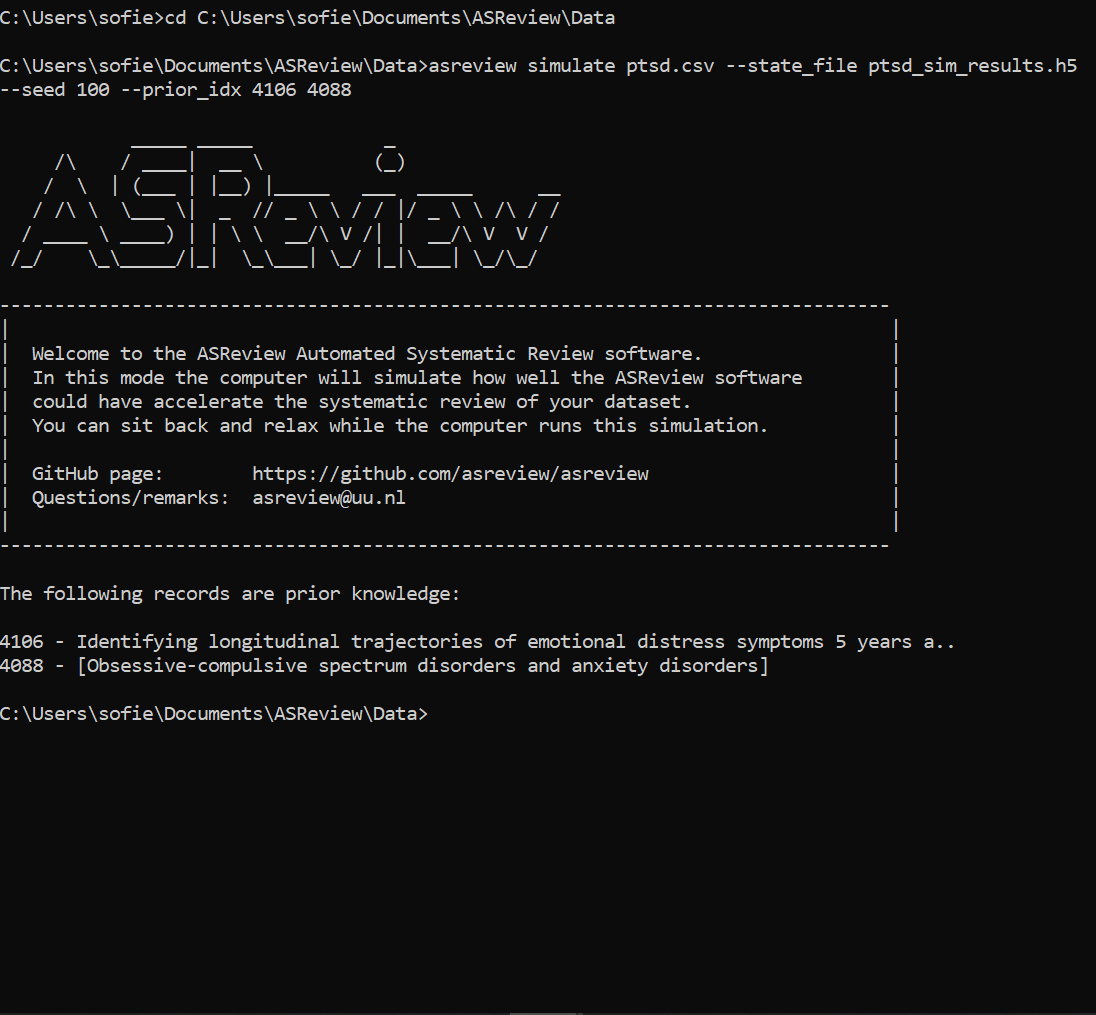
You can now start your simulation study. Use the following command for a single simulation run with the default settings:
asreview simulate [your_data.csv] ––state_file [simulation_results].h5 ––seed [your_favorite_number] ––prior_idx [the_row_numbers_of_the_prior_information]
Press Enter and your simulation will begin! You will know when it has finished when your file path appears again at the bottom of the Terminal or your Command Prompt.

Let’s break this command down to its building blocks so you know what is going on exactly:
- asreview simulate [your_data.csv]
This tells the machine that you want to use ASReview to run a simulation on your specified dataset. It knows where to find this data, because you already told the machine where it can find the file in the previous step.
- ––state_file [simulation_results].h5
This part defines the name of the state-file in which your results will be stored. Don’t forget to use the .h5 extension at the end of the state-file.
- ––seed [your_favorite_number]
Choose a number, any number between 0 and 4294967295! No really, that’s the limit of numbers you can choose to initialize the pseudo random number generating sequence.
- ––prior_idx [the_row_numbers_of_the_prior_information]
The same as in ASReview LAB, you can use more prior knowledge to give the active learning model a head start. To show the machine which records you want to use as prior knowledge, you can check your datafile to find the row indices corresponding to the records you want to use as prior information. When you have found the row numbers, subtract 1. Because the machine starts counting at 0 instead of 1. If you leave out the ––prior_idx part, the machine will randomly choose one relevant and one irrelevant record.
Hurray!
You just performed your first simulation study!
Statistics
Awesome, you have run your simulation study! But how do we know what the results look like? Let’s start with obtaining some informative numbers through the statistics extension.
Use the following command:
asreview stat [simulation_results].h5
After pressing Enter, the command returns 4 sections: general, settings, ATD, and WSS/RRF. Within the general section you find some basic information about the dataset and simulation. The number of queries simply means the number of queries that were performed. The settings inform you all about the simulation study you just performed, which active learning model was used, how many records were used as prior information etc. More information on their interpretation can be found within the documentation.

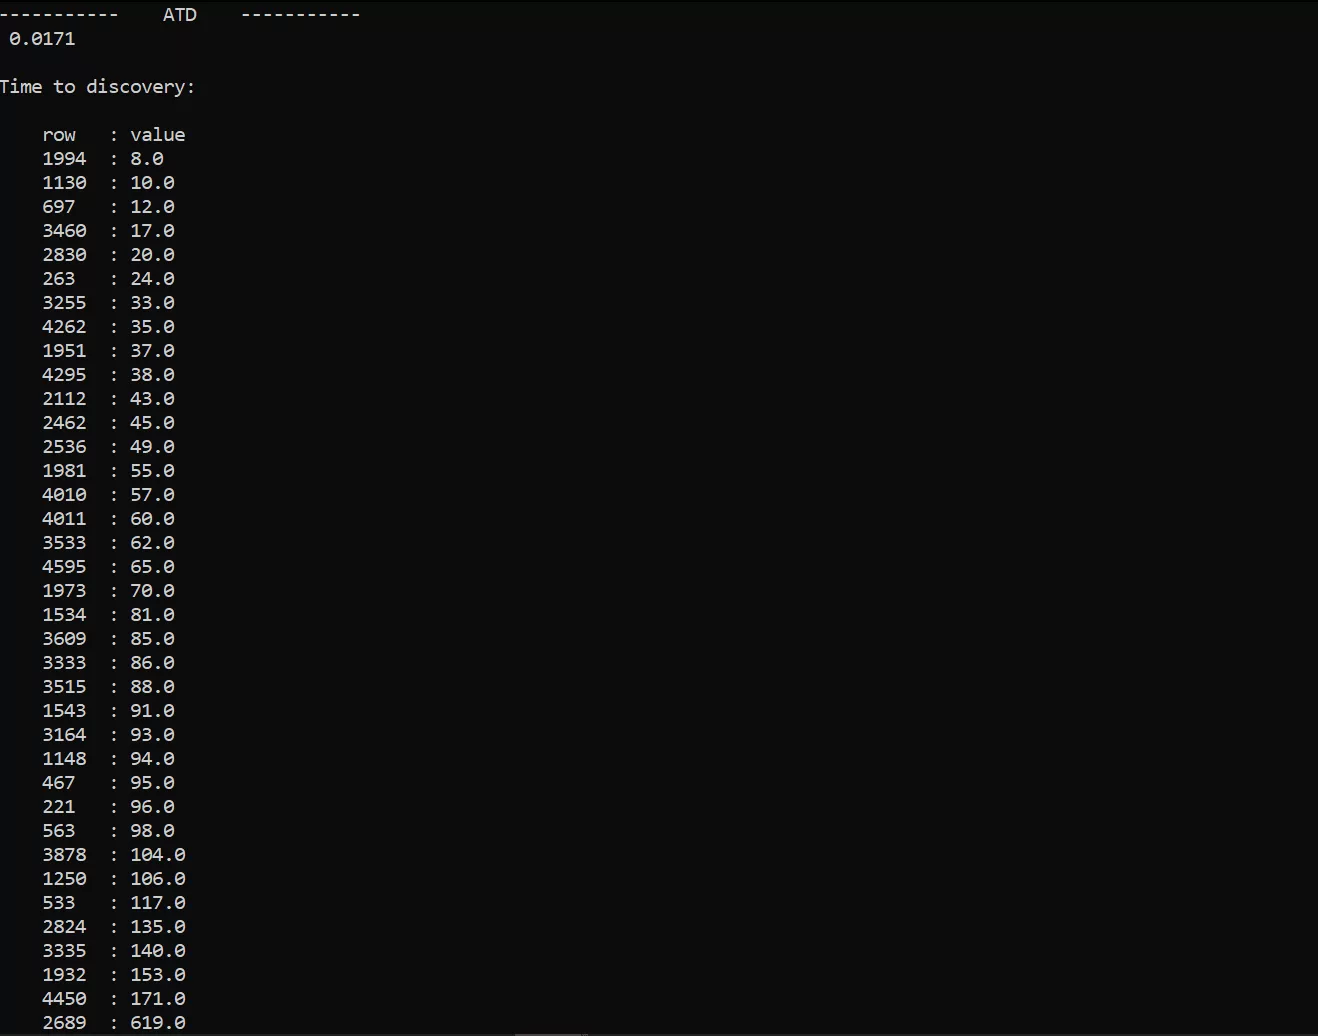
Then comes the section about ATD, “Well, what is this ATD?” you might be wondering. Be patient young Padawan, let’s first discuss the TD: the Time to Discovery. The Time to Discovery for each relevant publication shows you how many records a reviewer would have had to screen to find it. After providing prior knowledge, the first relevant records was found after screening 8 publications. If the TD of a single publication is consistently high relative to the other TD values, it could be that this particular publication is what we previously called ‘odd’. A record such as the last one here (row number 2689) could possibly be odd!
Great, now we can tackle the ATD, the Average Time to Discovery. This indicates how long it takes on average (expressed as a percentage of screened articles) to find a relevant publication. In this case, this means that on average, a reviewer only needed to screen 0.17% (around 9 papers) of the publications to find a relevant publication.

The ATD is an indicator of the performance throughout the entire screening process, but what if you want to know how much time/work you could have saved? Here you can use the Work Saved over Sampling (WSS) statistic. The WSS indicates the percentage of work a reviewer saves (by using Active Learning) compared to manual screening after finding a certain percentage or relevant publications. In this example, to find 95% of all articles (indicated by WSS@95%), Active Learning can save a reviewer from reading 93.9% of all publications. To find all articles (WSS@100%), a researcher is saved from reading 87.7%, which is roughly 4413 papers!
And on to the final statistic of today, the Relevant Records Found (RRF). This shows you the proportion of relevant publications that are found, after screening a a certain percentage of all publications. So if the RRF is set at 5% (RRF@5) and the result is 97.3%, it means that almost all relevant publications have been discovered after only screening 5% of the publication. For this simulation study the RRF is the same at 5% and 10%, because the last relevant publication is harder to find than the rest.

Visualization
To plot your results, type the following command:
asreview plot [simulation_results].h5
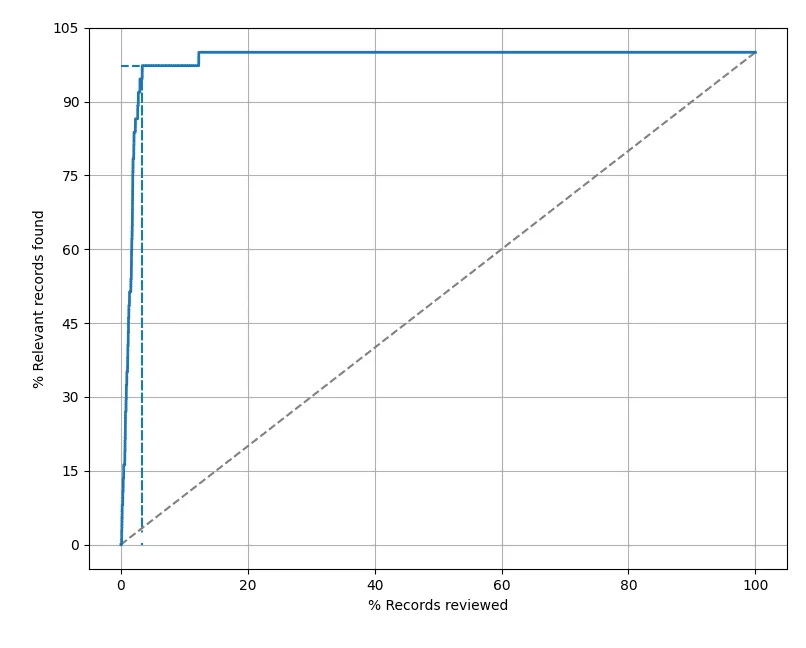
This opens a new window with the first out of four figures. As this blogpost is quite long already, we will only go into this first one, as it is the most insightful. You can find the percentage of relevant publications that were found on the y-axis and the percentage of screened publications on the x-axis.
- The blue solid line is the Recall curve, this displays the relevant records found as a function of the screened publications. The steeper this curve, the sooner the relevant publications were found. In other words the more work you could have saved by using ASReview.
- The grey striped line is a random screening line. When you would screen the records in a random order, such as happens with manual screening, you would have to screen all the records, to find all relevant publications. Meaning that on average the grey line is the rate at which you would find relevant publications.
- Blue striped lines represent statistics. The horizontal line (top left) indicates the RRF@10%, while the vertical line shows the WSS@95%.

The ASReview research team continuously uses simulation studies to tackle all kinds of questions. What happens when you use a different classification model, feature extraction method, query or balance strategy? Can we use Neural Networks to improve the performance of ASReview LAB even further? For example the default settings in ASReview LAB are the result of a simulation study performed by Ferdinands et al. Take a look at our research page to see what kind of simulation studies have been done!
To answer some more difficult questions yourself, or to change the settings, you can of course also alter the commands to suit your plans. These are some the options you can change:
- Add command: ––model [x] to change the machine learning classifier.
- Add command: ––n_runs [x] to change the number of runs, meaning that you can repeat your study with the same settings for any number of times.
PS. Change [X] to a number or the name of a classifier. You can just add these arguments to your original command asreview simulate. Find more available settings here.
And that’s it! You should now be able to create and run your own simulation studies on using AI to accelerate your screening processes. Pretty awesome right?
Dataset used for this simulation study example:
Find the dataset on the systematic review dataset repository. This dataset was used within the following systematic review:
van de Schoot, R., Sijbrandij, M., Winter, S. D., Depaoli, S., & Vermunt, J. K. (2017). The GRoLTS-Checklist: Guidelines for Reporting on Latent Trajectory Studies. Structural Equation Modeling: A Multidisciplinary Journal, 24(3), 451-467. http://dx.doi.org/10.1080/10705511.2016.1247646
How to cite?
Cite our project through this publication in Nature Machine Intelligence. For citing the software, please refer to the specific release of the ASReview software on Zenodo. For citing this blog please use the following citation:
van den Brand, S.A.G.E., van de Schoot, R. (2021). ASReview Simulation Mode: Class 101. Blogposts of ASReview.
Contributing to ASReview
Do you have any ideas or suggestions which could improve ASReview? Create an issue, feature request or report a bug on GitHub! Also take a look at the development fund to help ASReview continue on its journey to easier systematic reviewing.


1 Comment